Modelling Climate Erosivity Factor (CE) in LaSWE
Climate Erosivity is the ability of climatic condition in a particular area to yield an environment conducive for wind erosion. For wind erosion to occur: Threshold velocity of the wind must be attained to initiate particle movement. Soil particle size, shape, weight and mutual adherence of the particles, must be favorable. Soil surface must have minimal surface barrier that can stop movement of soil particles.
Climate erosivity is modelled by intergrating various variables including:
Wind speed
Potential evapotranspiration and
Rainfall amount (Precipitation)
The variables above are dynamic in nature, depending on the modelling period, they can be remodelled either seasonally, annually e.t.c.
Climate Erosivity is computed with the variables as represented in the equation below. The variables are described in the following sections.
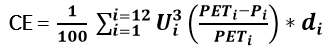
Where:
U is mean wind speed (m/s) at 2-10 m height in
PETi is mean potential evapotranspiration
Pi is precipitation (mm)
di is the total number of days’ observation was made (365 for annual observation)
Wind speed U and soil moisture (PET and P) are directly proportional to climatic erosivity while (PET) is inversely proportional to the climatic erosivity.
When the PET is greater than the precipitation, the moisture is evaporated from the soil, the adhesive force reduces, as a result the weight reduces making the particle susceptible to dettachment and transportation by wind. When the Precipitation is higher than potential evapotranspiration, moisture is absorbed by soil particles, the particles increases in weight due to adhesive force to surrounding particles, as a result the soil particles are less susceptible to detachment and transportation by the wind force.
Note:
The value ranges of the above parameters should be meaningful; it is recommended the values are rescaled to fit in within the meteorological known values for each particular datasets; because the remotely acquired datasets may not necessarily come with the expected value ranges. However, to generate a sensitivity map, the final CE is fuzzified by a linear function to yield values that are between 0 and 1 scale. Fuzzification saves a user the complexities of rescaling their values to meteorological tested ranges as applied by (Fryrear et al., 1998).
Modelling the climate erosivity, a user is expected to follow the following steps
Acquire the datasets
Compute the factors in RWEQ QGIS plugin
Fuzzify the output between 0 - 1, which is sensitivity map.
Combine it with other factors to compute the Index of Land Susceptibility to Wind Erosion (ILSWE).
Acquiring and Processing CE datasets
To acquire data for modelling of climate erosivity, a user is expected to use the data sources as highlighted in the data source section. The project also implemented a user manual that aids the user in preparing the datasets in a customed QGIS plugin, which is provided as a zipped folder for the user download and use. However, the use of google earth engine is also permitted especially in acquiring and computing the factors. A simple code in google earth engine of acquiring and computing CE datasets and factor is as shown in the code block below.
    ///////////////////////////////////////////////////////////////////////////////////////////
/////////////////////////////////////CLIMATIC DATASETS (CE)

//Rainfall

var dataset = ee.ImageCollection('TRMM/3B43V7')
                  .filter(ee.Filter.date('2019-01-01', '2019-12-30'));
var ppt = dataset.select('precipitation').mean().clip(East_Africa);

//////////////////////visualisation parameters for precipitation
var precipitationVis = {
  min: 0.1,
  max: 1.2,
  scale:100,
  palette: ['blue', 'purple', 'cyan', 'green', 'yellow', 'red'],
};
Map.centerObject(East_Africa);


//////////Exportrainfall to drive
Export.image.toDrive({image:ppt, scale: 300, description: 'ppt', fileNamePrefix: 'PPT',
    region: table, maxPixels: 1e13});


 ////////////////////Acquiring evapotranspiration data
varpet =ee.ImageCollection('NASA/FLDAS/NOAH01/C/GL/M/V001')
              .filter(ee.Filter.date('2020-01-01', '2020-12-01'));
var pet = dataset.select('Evap_tavg').mean().clip(table);

var band_viz = {
  min: 0.0,
  max: 0.00005,
  opacity: 1.0,
  scale: 100,
  palette: ["black", "blue", "purple", "cyan", "green", "yellow", "red"]
};


Map.addLayer(pet, band_viz, 'Average Evapotranspiration')

  /////////////////////Wind speed acquisition

  var dataset = ee.ImageCollection("ECMWF/ERA5_LAND/HOURLY")
 .filterBounds(table)
 .filterDate('2020-01-01','2020-12-06')
 .select('v_component_of_wind_10m','u_component_of_wind_10m').mean().clip(table);
  print(dataset)

  var ws_u = ee.ImageCollection("ECMWF/ERA5_LAND/HOURLY")
           .filterBounds(table)
           .filterDate('2020-01-05','2020-12-30')
           .select('u_component_of_wind_10m').mean().clip(table);

  var windSpeed = dataset.select('v_component_of_wind_10m');

  var windSpeed_u = dataset.select('u_component_of_wind_10m');


  var windSpeedVis = {"min":-4,"max":4.2,"palette":["001137","01abab","e7eb05","620500"]}
  var windDirVis = {"min":0,"max":360,"pallette":["000000","FFFFFF"]}


  var WS_MAGNITUDE = dataset.expression('(((nir) * (nir)) + ((red) * (red)))**0.5'
     ,{
         'nir':dataset.select(['v_component_of_wind_10m']),
         'red':dataset.select(['u_component_of_wind_10m'])
            }
           ).rename('WS_MAGNITUDE');

  print(WS_MAGNITUDE);


/////CLIMATE EROSIVITY

var clim_bands = ppt.addBands(pet).addBands(WS_MAGNITUDE);
print(clim_bands);

var clim_bands2 = clim_bands.rename(['Preci','Evapo','WS']);

var CE = clim_bands2.expression('((((PET - P)/P) * 12) * (U * U * U)) * 0.01', {


            'PET':clim_bands2.select('Evapo'),
            'P':clim_bands2.select('Preci'),
            'U':clim_bands2.select('WS'),

            }).rename ('Climate Erosivity');

print(CE)
Map.addLayer(CE,{}, 'Climate Erosivity');
Export.image.toDrive({image:CE, scale: 4000, description: 'CE', fileNamePrefix: 'ce',
    region: table, maxPixels: 1e13});
Users who are not familiar with google earth engine, can use This Wind Erosion manual to compute the factors in the QGIS Plugin.
The user can download the plugin, install as illustrated in the manual, and follow the manual to compute all the factors.