Modelling Soil Crust Factor - (SC) in LaSWE
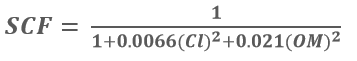
Soil surfaces with high soil crust factor tend to form a resistive layer to wind erosion as a protective mechanism (Fenta et al., 2020). This happens in places that are highly susceptible to wind erosion. Areas susceptible to wind erosion may try to shield themselves from destructive forces such as wind erosion, thus the formation of the crusting layer. The equation below is applied in the modelling of SCF.
Where:
Cl Sand to clay ratio OM organic matter content
The equation shows an inverse proportionality, whereby the areas susceptible to wind erosion with respect to soil crust factor have either little or no clay and organic content.
SCF is also linear in nature and the results were fuzzified to yield a sensitivity map showing high and low areas of soil crust.
In modelling SC, a user is expected to follow the following steps
Acquire SOIL DATASETS
Compute the factors in RWEQ QGIS plugin
Fuzzify the output between 0 - 1, which is sensitivity map.
Combine it with other factors to compute the Index of Land Susceptibility to Wind Erosion (ILSWE).
Acquiring and Processing SC datasets
To acquire data for modelling of SOIL CRUST, a user is expected to use the data sources as highlighted in the data source section. The project also implemented a user manual that aids the user in preparing the datasets in a customed QGIS plugin, which is provided as a zipped folder for the user download and use. However, the use of google earth engine is also permitted especially in acquiring and computing the factors. A simple code in google earth engine of acquiring and computing SC datasets and factor is as shown in the code block below.
var clay = ee.Image("OpenLandMap/SOL/SOL_CLAY-WFRACTION_USDA-3A1A1A_M/v02")
          .select('b30')
          .clip(table);

// Map.addLayer(clay,{},'clay content');

var sand = ee.Image("OpenLandMap/SOL/SOL_SAND-WFRACTION_USDA-3A1A1A_M/v02")
          .select('b30')
          .clip(table);

// Map.addLayer(sand,{},'sand content');


var org = ee.Image("OpenLandMap/SOL/SOL_ORGANIC-CARBON_USDA-6A1C_M/v02")
          .select('b30')
          .clip(table);

// Map.addLayer(org,{},'Organic Content');


var silt = ee.Image("OpenLandMap/SOL/SOL_TEXTURE-CLASS_USDA-TT_M/v02")
          .select('b30')
          .clip(table);

// Map.addLayer(silt,{},'Organic Content');


var soil_bands = sand.addBands(clay).addBands(org).addBands(silt);

print (soil_bands);

// Map.addLayer(soil_bands.rename(['sand','clay','org','silt']),{},'Soilbands');

var bands_named = soil_bands.rename(['sand','clay','org','silt']);

// Map.addLayer(bands_named.select('silt'),{},'silt_add');


////////////////////////Multiplying the SOIL PARAMETERS


var SC = bands_named.expression('1/1 + (0.0066 * (CL * CL)) + 0.21 * (OM * OM)', {
            'OM':bands_named.select('org'),
            'CL':bands_named.select('clay'),
            }).rename ('Soil Crust');

Map.addLayer(SC,{},'Soil Crust');

Export.image.toDrive({image:SC, scale: 100, description: {}, fileNamePrefix: 'SC',
    region: table, maxPixels: 1e13});
Users who are not familiar with google earth engine, can use This Wind Erosion manual to compute the factors in the QGIS Plugin.
The user can download the plugin, install as illustrated in the manual, and follow the manual to compute all the factors.